Explore All Exams at KGS


All Exams
Explore All Exams at KGS

Khan Sir Courses
Geography I Polity I History | World Map I Indian Map I Economics I Biology

UPSC & State PSC
UPSC I BPSC I UP-PSC I MP-PSC

State Exams
UP I Bihar I MP | Rajasthan

NEET | JEE | CUET
NEET | JEE | CUET

Defence Exams
NDA I CDS I CAPF I AFCAT I SSB I Agniveer

Police Exams
UP SI | Bihar SI | Delhi Police | UP Constable

SSC Exams
CGL I CPO I CHSL I MTS I SSC GD I Delhi Police

Foundation Courses
Physics I Chemistry I Biology I History I Geography I Polity I NCERT I Math I English | Map I Reasoning

Railway Exams
RRB | RPF

Teaching Exams
TET | Teaching | UGC

Banking Exams
SBI | RBI | IBPS

Engineering Exams
Civil | Electrical | Mechanical
UGC NET
UGC NET/JRF
Current Affairs provides you with the best compilation of the Daily Current Affairs taking place across the globe: National, International, Sports, Science and Technology, Banking, Economy, Agreement, Appointments, Ranks, and Report and General Studies
Current Affairs
SYLLABUS
GS-2: Issues Relating to Development and Management of Social Sector/Services relating to Health, Education, Human Resources.
Context: Chandigarh and Kerala have retained the top two positions in the recently released School Education Development Index (SEDI) 2025-26, with Chandigarh recording the highest overall score among States and Union Territories.
Key Findings of SEDI 2025-26
• Marginal Overall Improvement: The national average SEDI increased marginally from 0.566 in 2024-25 to 0.568 in 2025-26.
• Top Performers: Chandigarh (0.826) and Kerala (0.798) retained the top two positions, followed by Puducherry (0.737), Goa (0.713) and Delhi (0.709).
• Bottom Performers: Bihar (0.382), Arunachal Pradesh (0.358) and Meghalaya (0.307) remained the bottom three, indicating persistent structural disparities.
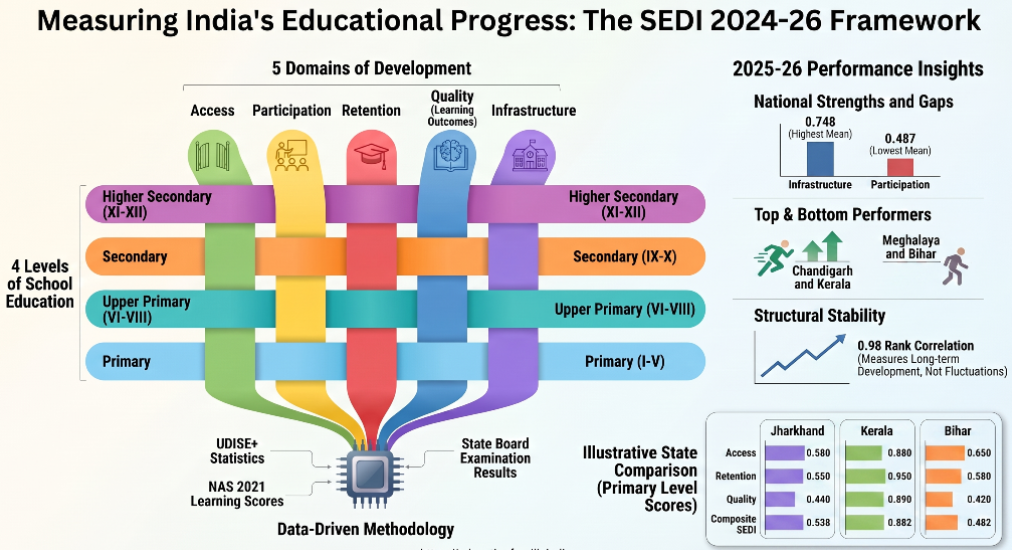
• Participation as the Weakest Domain: Participation recorded the lowest national average at 0.487, despite improving from 0.484, reflecting continuing challenges in SC/ST and gender equity, enrolment and transition rates.
• Infrastructure Leads: Infrastructure recorded the highest national average at 0.748, up from 0.741, and also the widest interstate spread — from 0.982 in Chandigarh to 0.159 in Meghalaya.
• Later Schooling Stages: Secondary and Higher Secondary show substantial interstate disparities, with several States recording considerably lower scores at these stages than at the elementary levels.
• Major Improvers: Mizoram recorded the largest SEDI gain (+0.052; rank 28→22), followed by West Bengal (+0.032; 21→17), Meghalaya (+0.039) and Telangana (+0.026; 17→14).
• Sharpest Decline: Uttarakhand recorded the sharpest rank decline, falling from 15th to 19th with a SEDI decline of 0.019.
Understanding the School Education Development Index (SEDI)
• Developer and Background: SEDI 2025-26 has been prepared by Prof. Arun C. Mehta, former Head of the EMIS Department, NIEPA, building on the Educational Development Index (EDI) developed at NUEPA/NIEPA during 2005-06 to 2014-15.
• Purpose: SEDI goes beyond enrolment statistics to assess whether schools are accessible and functional, whether children participate and remain in the system, and whether they learn effectively.
• Assessment Framework: The index covers 36 States/UTs, four school-education levels — Primary, Upper Primary, Secondary and Higher Secondary — and 73 indicators across five domains: Access, Participation, Retention, Quality and Infrastructure.
• Composite Score: The four school levels are combined using 30%, 25%, 25% and 20% weights for Primary, Upper Primary, Secondary and Higher Secondary respectively, while domain-level indices are combined using the prescribed domain weights.
• Data Sources: UDISE+ 2025-26 provides the main data, while NAS 2021 (NCERT) supplies learning-outcome indicators under the Quality domain.
• NEP 2020 Alignment: The revised framework aligns with the NEP 2020 curricular-stage structure, expands the earlier EDI framework from two to four school levels and introduces Retention as a dedicated domain.
What Does SEDI Reveal About India’s School-Education Challenge?
• From Access to Participation: The relatively low Participation score shows that expanding school availability alone is insufficient; enrolment, equity and grade-level transition remain critical challenges.
• Infrastructure–Outcome Gap: Infrastructure has the highest national score, but weaker Participation and Quality scores suggest that improved physical and ICT infrastructure must be complemented by stronger participation and learning outcomes.
• Secondary Education as a Bottleneck: The relatively weaker and more uneven performance at Secondary and Higher Secondary levels points to difficulties in retaining and progressing students through the later stages of schooling.
• Persistent Regional Disparities: The wide variation across States/UTs — particularly in Infrastructure and Participation — highlights significant differences in educational access, equity, retention and quality.
Way Forward
• Strengthen Participation and Retention: Target enrolment, grade-level transitions and dropout prevention, particularly at Secondary and Higher Secondary stages.
• Shift from Inputs to Outcomes: Complement infrastructure expansion with greater emphasis on learning outcomes, classroom processes and effective utilisation of facilities.
• Adopt State-Specific Strategies: Use domain- and level-wise SEDI results to identify State/UT-specific bottlenecks and design targeted interventions rather than uniform solutions.
• Ensure Convergence: Align interventions under Samagra Shiksha and other school-education initiatives to address the interconnected challenges of access, participation, retention, quality and infrastructure.
Khan Global Studies App
With our training programs, learning online can be a very exciting experience. Take the next step toward achieving your professional and personal objectives.



Course Related Query:
Ask Your DoubtsStore Related Query:[email protected]NEET | JEE | CUET
NCERT Books
Resources
We love learning. Through our innovative solutions, we encourage ourselves, our teams, and our Students to grow. We welcome and look for diverse perspectives and opinions because they enhance our decisions. We strive to understand the big picture and how we contribute to the company’s objectives. We approach challenges with optimism and harness the power of teamwork to accomplish our goals. These aren’t just pretty words to post on the office wall. This is who we are. It’s how we work. And it’s how we approach every interaction with each other and our Students.
Come with an open mind, hungry to learn, and you’ll experience unmatched personal and professional growth, a world of different backgrounds and perspectives, and the freedom to be you—every day. We strive to build and sustain diverse teams and foster a culture of belonging. Creating an inclusive environment where every students feels welcome, appreciated, and heard gives us something to feel (really) good about.